


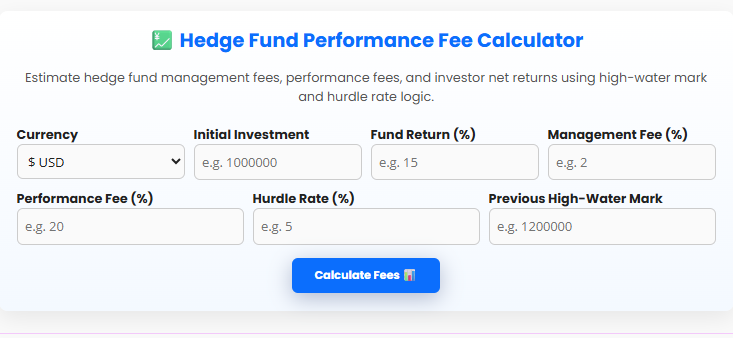
💹 Hedge Fund Performance Fee Calculator
Estimate hedge fund management fees, performance fees, and investor net returns using high-water mark and hurdle rate logic.
Share your result
WhatsApp
Facebook
X
LinkedIn
Pinterest
💹 Hedge Fund Performance Fee Calculator – Accurately Measure Investor Returns and Fund Profitability
Introduction – The Economics Behind Hedge Fund Fees
Hedge funds represent the most sophisticated layer of the global investment ecosystem, often delivering market-beating returns through active management and complex strategies. Yet behind every impressive performance report lies a structured fee mechanism that determines how profits are distributed between investors and fund managers.
Understanding how these fees work is essential for both Limited Partners (LPs) and General Partners (GPs).
A Hedge Fund Performance Fee Calculator simplifies this process, transforming technical formulas into clear, actionable results.
By entering a few key figures — including the initial investment, gross return, management fee, performance fee, hurdle rate, and high-water mark — the calculator outputs the net investor return after fees and the manager’s earnings.
This quantitative clarity allows investors to evaluate fund economics transparently and assess whether fees align with performance delivered.
How Hedge Fund Fee Structures Work
Hedge fund managers are compensated through two main components, often summarized as the “2 and 20” model:
-
Management Fee (2%) – A fixed annual charge on assets under management (AUM).
-
Performance Fee (20%) – A share of the fund’s profits, paid only when performance exceeds specific thresholds.
These thresholds are defined by hurdle rates and high-water marks, ensuring managers earn incentive fees only for genuine performance gains.
1. Management Fee
The management fee is designed to cover operational costs — research, compliance, salaries, and trading infrastructure.
It is calculated as a percentage of the total AUM, typically charged annually or quarterly.
Formula:
Management Fee=AUM×Fee Ratetext{Management Fee} = text{AUM} × text{Fee Rate}Management Fee=AUM×Fee Rate
Example:
A fund with $100 million AUM and a 2% annual fee charges:
100M×0.02=2M100M × 0.02 = 2M100M×0.02=2M
This fee is earned regardless of fund performance, ensuring steady income for the management company.
2. Performance Fee
The performance fee is the incentive portion — generally 20% of profits exceeding the hurdle rate or previous high-water mark.
This structure rewards alpha generation while protecting investors from paying fees on unrecovered losses.
Formula:
Performance Fee=(Ending NAV–Hurdle or High-Water)×Performance Ratetext{Performance Fee} = (text{Ending NAV} – text{Hurdle or High-Water}) × text{Performance Rate}Performance Fee=(Ending NAV–Hurdle or High-Water)×Performance Rate
Typical Ranges:
| Fund Type | Performance Fee | Notes |
|---|---|---|
| Global Macro | 20%–25% | Common in multi-strategy funds |
| Long/Short Equity | 15%–20% | Depends on volatility |
| Quant / CTA Funds | 20% | Algorithmic performance-based |
| Fund of Funds | 10%–15% | Layered fees |
3. Hurdle Rate
The hurdle rate ensures investors earn a minimum annualized return before performance fees apply.
Commonly set between 5–8%, it represents the minimum acceptable rate of return (MAR) for LPs.
Example:
If a fund delivers 12% gross return and the hurdle is 6%, performance fees apply only to the excess 6% gain.
4. High-Water Mark
The high-water mark (HWM) protects investors by preventing performance fees on previously lost capital.
Once a fund declines in value, the manager must recover prior losses before collecting any new incentive fees.
Example:
| Year | Starting NAV | End NAV | Performance | Fee Eligibility |
|---|---|---|---|---|
| 1 | $1,000,000 | $900,000 | -10% | No fee |
| 2 | $900,000 | $950,000 | +5.5% | Still below HWM – no fee |
| 3 | $950,000 | $1,100,000 | +15.7% | Above $1M – performance fee applies on $100,000 gain |
Using the Hedge Fund Performance Fee Calculator
This calculator integrates all major hedge fund fee concepts.
Required Inputs
| Input | Description |
|---|---|
| Initial Investment | The investor’s starting capital. |
| Fund Return (%) | Gross annual fund performance. |
| Management Fee (%) | Annual fee on AUM (e.g., 2%). |
| Performance Fee (%) | Share of profits (e.g., 20%). |
| Hurdle Rate (%) | Minimum LP return before fees (e.g., 5%). |
| High-Water Mark | Previous peak portfolio value. |
Outputs
-
Gross Profit
-
Management Fee Paid
-
Performance Fee (after hurdle & HWM)
-
Net Value to Investor
-
Net Return After Fees
Step-by-Step Calculation Example
Scenario:
-
Initial Investment = $1,000,000
-
Fund Return = 15%
-
Management Fee = 2%
-
Performance Fee = 20%
-
Hurdle Rate = 5%
-
Previous High-Water Mark = $1,000,000
1. Gross Profit
1,000,000×15%=150,0001,000,000 × 15% = 150,0001,000,000×15%=150,000
2. Management Fee
1,000,000×2%=20,0001,000,000 × 2% = 20,0001,000,000×2%=20,000
3. Hurdle Threshold
1,000,000×(1+0.05)=1,050,0001,000,000 × (1 + 0.05) = 1,050,0001,000,000×(1+0.05)=1,050,000
The hurdle must be exceeded before any performance fee applies.
4. Eligible Profit
1,150,000–1,050,000=100,0001,150,000 – 1,050,000 = 100,0001,150,000–1,050,000=100,000
5. Performance Fee
100,000×20%=20,000100,000 × 20% = 20,000100,000×20%=20,000
6. Net Value to Investor
1,150,000–20,000–20,000=1,110,0001,150,000 – 20,000 – 20,000 = 1,110,0001,150,000–20,000–20,000=1,110,000
7. Net Investor Return
(1,110,000÷1,000,000–1)×100=11.0%(1,110,000 ÷ 1,000,000 – 1) × 100 = 11.0%(1,110,000÷1,000,000–1)×100=11.0%
✅ The investor earned 11% after fees.
✅ The fund manager received $40,000 total compensation ($20K management + $20K performance).
Scenario 2 – High-Water Mark in Action
Suppose last year’s ending NAV was $1,200,000, and this year’s fund return is +10%.
New NAV = $1,320,000
Since the previous HWM was $1.2M, only gains above that threshold ($120K) are subject to performance fees.
Performance Fee = $120,000 × 20% = $24,000
If the fund later drops to $1.0M, no fee is collected until it again surpasses $1.2M — preserving investor fairness.
Scenario 3 – Including a Hurdle Rate and High-Water Mark Together
| Parameter | Value |
|---|---|
| Initial Capital | $1,000,000 |
| Hurdle Rate | 6% |
| High-Water Mark | $1,050,000 |
| Fund Return | 12% |
| Performance Fee | 20% |
Hurdle threshold = $1,060,000
Eligible profit = $1,120,000 – $1,060,000 = $60,000
Performance Fee = $60,000 × 20% = $12,000
Investor Net Value = $1,108,000 (10.8% return).
Why These Models Matter
Fee structures define alignment of interest between fund managers and investors.
-
High fees without hurdles may reduce investor alpha.
-
Hurdle rates and HWMs protect LPs and enforce merit-based incentives.
-
Modeling with a calculator enables transparent fee disclosure, now demanded by regulators and sophisticated LPs.
Comparing Hedge Funds vs Mutual Funds
| Feature | Hedge Fund | Mutual Fund |
|---|---|---|
| Fee Structure | 2% + 20% | 0.5%–1.5% (flat) |
| Performance Fee | Yes, profit-based | Rare |
| Hurdle / HWM | Common | None |
| Liquidity | Restricted (lock-ups) | Daily redeemable |
| Transparency | Limited (private reporting) | Regulated public filings |
| Investor Type | Accredited / Institutional | Retail |
This comparison highlights how hedge fund fee structures reward alpha generation, not asset gathering.
Global Hedge Fund Fee Benchmarks (2025)
| Region | Avg Management Fee | Avg Performance Fee | Trend |
|---|---|---|---|
| North America | 1.6% | 18% | Slight decline since 2020 |
| Europe | 1.5% | 17% | Increased use of hurdles |
| Asia | 1.8% | 20% | Growth in long/short funds |
| Global Average | 1.6% | 18.5% | Stable but competitive |
Source: Preqin Global Hedge Fund Report 2025
Performance Fee Alignment and Investor Impact
Hedge funds must balance incentive alignment with fee fairness:
-
Over-incentivized models may encourage risk-taking.
-
Under-incentivized models reduce manager motivation.
-
Properly structured fees create long-term sustainability.
Regulatory bodies such as the SEC now emphasize disclosure transparency, requiring clear investor reporting of fee calculations — exactly what this calculator provides.
Advanced Metrics – Net Returns After Fees
| Gross Return | Net Return (2% + 20%) | Investor Retention (%) |
|---|---|---|
| 10% | 7.6% | 76% |
| 15% | 11% | 73% |
| 20% | 14.4% | 72% |
| 30% | 21.2% | 71% |
As gross returns rise, a larger percentage flows to managers, but LPs retain the majority of upside.
How to Use the Calculator for Fund Comparison
-
Input identical investment and hurdle data across multiple funds.
-
Vary the performance fee rate to compare net investor outcomes.
-
Apply historical fund NAVs to simulate high-water mark recovery effects.
-
Evaluate consistency — funds with steady HWMs and lower drawdowns provide more reliable fee-adjusted alpha.
Advantages of Using This Calculator
✅ Transparency: Immediate clarity on how much investors retain vs managers earn.
✅ Accuracy: Incorporates hurdle and high-water thresholds automatically.
✅ Speed: Instant computation of complex fee structures.
✅ Adaptability: Works across all currencies and fund sizes.
✅ Professional Insight: Ideal for LP reporting and due diligence presentations.
Limitations
-
Assumes a single-year fee period (multi-year compounding requires NAV tracking).
-
Does not include fund expenses (admin, audit, brokerage).
-
Hurdle and HWM values assumed constant for simplicity.
Still, for comparative and educational use, the calculator provides high precision and immediate insight.
Frequently Asked Questions (FAQs)
1. What is a hedge fund performance fee?
A performance-based incentive paid to fund managers, usually 20% of profits above a hurdle or high-water mark.
2. How is the management fee calculated?
As a fixed percentage (e.g., 2%) of total assets under management, charged annually.
3. What is a high-water mark?
The fund’s highest historical value. Performance fees apply only when this value is surpassed.
4. Why use a hurdle rate?
It ensures managers earn performance fees only when exceeding a minimum return (e.g., 5–8%).
5. Can both hurdle and high-water mark apply together?
Yes, many institutional funds combine them for stronger investor protection.
6. What is the standard hedge fund fee structure?
Traditionally “2 and 20,” though newer funds often use “1.5 and 15” to attract LPs.
7. How do fees affect long-term returns?
Compounded fees reduce investor IRR significantly — small percentage differences matter greatly.
8. What happens in a loss year?
No performance fees are charged, and the high-water mark resets only when prior losses are recovered.
9. Are performance fees tax-deductible?
They’re typically treated as fund expenses before investor distributions, varying by jurisdiction.
10. Who benefits most from this calculator?
Investors, fund administrators, analysts, and finance students analyzing hedge fund economics.
Conclusion
In the hedge fund world, fees define alignment. The right balance ensures investors are protected while managers remain motivated to outperform benchmarks.
The Hedge Fund Performance Fee Calculator transforms a notoriously complex process into a transparent, data-driven exercise.
It quantifies the interplay between gross return, hurdle rate, and high-water marks, revealing the true net investor ROI and manager incentive value.
Whether you’re an institutional investor comparing funds or a fund manager designing compensation models, this tool provides precision and confidence in decision-making.
In finance, transparency isn’t a luxury — it’s a responsibility.
This calculator delivers that transparency, one equation at a time.
Please don’t forget to leave a review.